Guide
Fitness, fatigue and form, explained
Three lines on one chart. Together they show how much training you’ve built up, how tired it’s made you, and whether you’re fresh enough to race. TrainingPeaks calls it the Performance Management Chart, and you’ll also see the lines called CTL, ATL and TSB. This guide explains them with examples, no formulas.
 Samuel KraftUpdated
The short version
- Every workout gets a load score. An hour as hard as you can hold scores 100.
- Fitness is your average daily load over the last six weeks. It changes slowly.
- Fatigue is your average daily load over the last week. It changes fast.
- Form is fitness minus fatigue. It goes negative when you train hard and positive when you rest.
It starts with one number per workout
All three lines are built from the same thing: a training load score for each workout. It combines how long you went with how hard you went, measured against your threshold, which is the effort you could hold for about an hour.
An hour at threshold scores 100. An easy hour scores around 50. A three-hour easy ride can score more than a hard hour, which is fair: it costs you a lot too. If you’ve seen the term TSS, this is that number.
- 30 minutes recovery spin at 55% of FTP15
- 1 hour easy at 70% of FTP49
- 1 hour as hard as you can hold at 100% of FTP100
- 3 hours easy at 65% of FTP127
Because the score is measured against your own threshold, a run, a ride and a swim can be added together. Shape scores each workout from the best data it has: power on the bike, pace for runs and swims, and heart rate for everything else. You can try each formula with the TSS calculator (power), the rTSS calculator (running pace) and the heart rate calculator.
Fitness: what you’ve built (CTL)
Fitness is your average daily load over the last 42 days, about six weeks. Recent days count a little more than older ones, so the line moves smoothly instead of jumping when an old week falls out of the window. Train an average of 60 a day and your fitness settles at 60.
It moves slowly on purpose. A workout that scores 100 puts fitness about 2.4 points higher than skipping it would have. One big week barely shows. Six steady weeks show a lot.
Fitness here means how much training your body is used to handling. It’s not your race pace or your VO2 max. A rising line means you’re doing more, which usually makes you faster, but the chart can’t promise that.
Fatigue: what it cost you (ATL)
Fatigue is the same kind of average, over the last 7 days instead of 42. The short window makes it react fast. That same 100 workout adds about 13.3 points to fatigue on the day, more than five times what it adds to fitness. Most of it’s gone again within a week.
- Fitness
- Fatigue
- Form
Here is the same idea from the other side: how much of one workout each line still counts as the days go by. Fatigue forgets fast. Fitness remembers for weeks.
- Still in fitness
- Still in fatigue
Form: what is left to spend (TSB)
Form is fitness minus fatigue.
When your last week was harder than your six-week average, fatigue sits above fitness and form is negative. That’s normal. It’s what training more than you’re used to looks like, and it’s how fitness goes up.
When you ease off, fatigue falls much faster than fitness, so form turns positive and you feel fresh. That’s the whole idea behind a taper: give up a little fitness to lose a lot of fatigue.
- Fitness
- Fatigue
- Form
| Fitness | Fatigue | Form | |
|---|---|---|---|
| Normal weeks | 60.0 | 60.0 | 0 |
| After the hard week | 64.6 | 79.0 | -14.4 |
| After the easy week | 59.3 | 48.0 | +11.3 |
Over the easy week, fitness dropped 5 points and form went up 26. That trade is why you rest before a race.
What the form numbers mean
There’s no official scale, but these are the rough ranges many coaches use. The examples from this guide are marked on it.
- Below -30
- Deep fatigue. Fine for a training camp of a week or two. Stay there for weeks and the risk of illness or injury goes up.
- -30 to -10
- A normal hard block. You’re training more than you’re used to, which is how fitness goes up.
- -10 to +5
- In between. You’re roughly maintaining, and not much is changing.
- +5 to +25
- Fresh. Where most people want to be on race day.
- Above +25
- Very fresh. Great for a day, but if it lasts you’re losing fitness, like at the end of a season.
Read them with your fitness in mind. A form of -20 is a deep hole when your fitness is 30, and an ordinary week when it’s 100. The load ratio below takes care of that for you.
Load ratio: is this week too much?
Shape also shows a load ratio, which is fatigue divided by fitness. It answers one question: is this week out of step with the last six? Because it’s a ratio, it reads the same at any fitness level.
- Under 0.8Low
- You’re easing off.
- 0.8 to 1.3Balanced
- The sweet spot. You’re adding load at a pace you can absorb.
- 1.3 to 1.5Elevated
- Fine for a short block. Worth keeping an eye on.
- Above 1.5High
- You’re adding load faster than your body can keep up with.
The hard week above ends at a ratio of 1.22, still balanced.
What happens when you stop
Here is someone training 60 a day who takes two weeks completely off. Fatigue is nearly gone after the first week. Fitness falls more slowly: 51 after one week, 43 after two.
- Fitness
- Fatigue
- Form
So a week off with a cold costs about 15% of your fitness on the chart, and two weeks about 28%. Form shoots up while you’re off. That’s not a sign you’re ready to race, only that the tiredness is gone.
Try it: plan a taper
A taper is the easy stretch before a race. Too short and you race tired. Too long and you lose fitness. Move the sliders and watch form on race day.
Racing straight off this build, form is about -10. A one-week taper at half the training takes it to +11, and fitness only drops from 70 to 65.
- Fitness
- Fatigue
- Form
Race-day fitness65-5
Race-day form+11+20
Fresh. A good place to race from.
How Shape draws the chart
In Shape the chart lives on the Today page. Solid lines are what you have done. Dashed lines show what happens if you do the workouts on your calendar, up to eight weeks ahead, so you can see what your plan does to your form on race day before you start it.
Only finished workouts move today’s numbers. Planned ones only draw the dashed line, and a planned workout you skip drops out.
- Fitness
- Fatigue
- Form
- Planned
Things that throw the numbers off
- Older workouts that aren’t in yet. Fitness is a six-week average, so it reads truest with your whole training history behind it. Wahoo brings all of it in when you connect. Garmin sends the last 30 days, so upload your Garmin export once and fitness counts every workout from day one.
- Thresholds that are out of date. Every score is measured against your threshold. If your FTP is set too low, every ride looks harder than it was, and fitness and fatigue both read high. Update your thresholds when your fitness changes.
- Workouts with no data. A workout with no heart rate, power or pace has no load unless you add one, so a strength session without a heart rate strap doesn’t show up on the chart.
- Life outside training. The chart only sees workouts. It doesn’t know about a bad night’s sleep, a stressful week at work or a cold. That’s what readiness is for: it reads your sleep, resting heart rate and HRV.
Questions
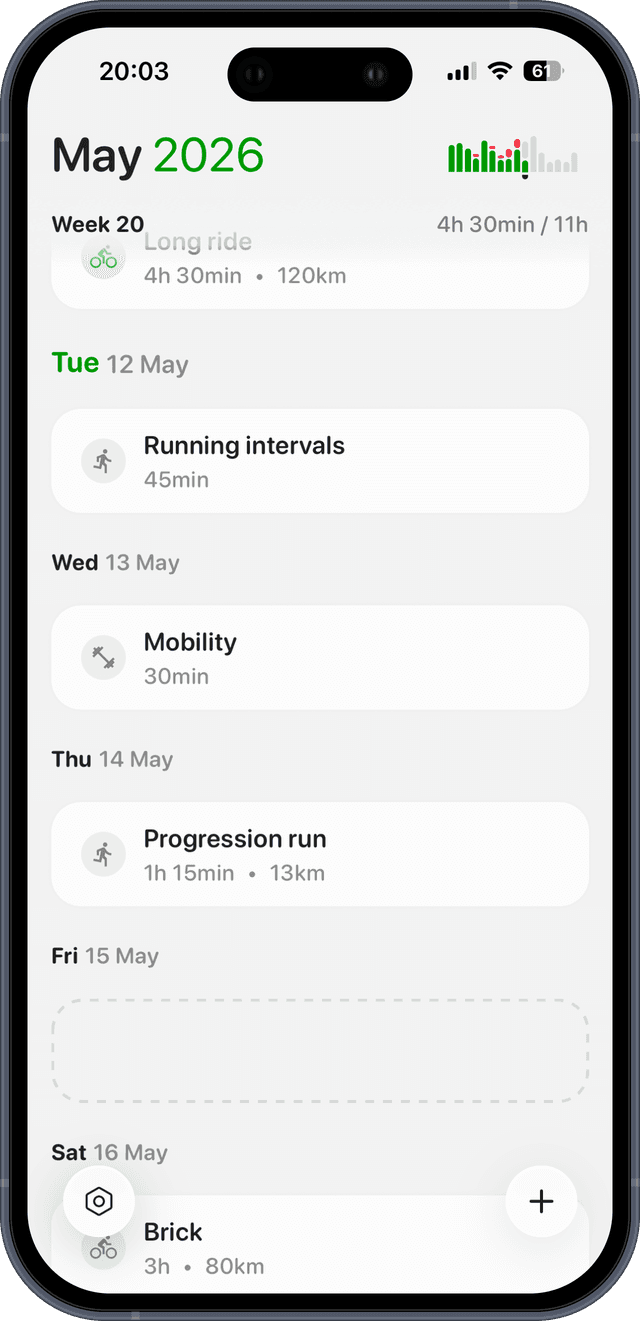
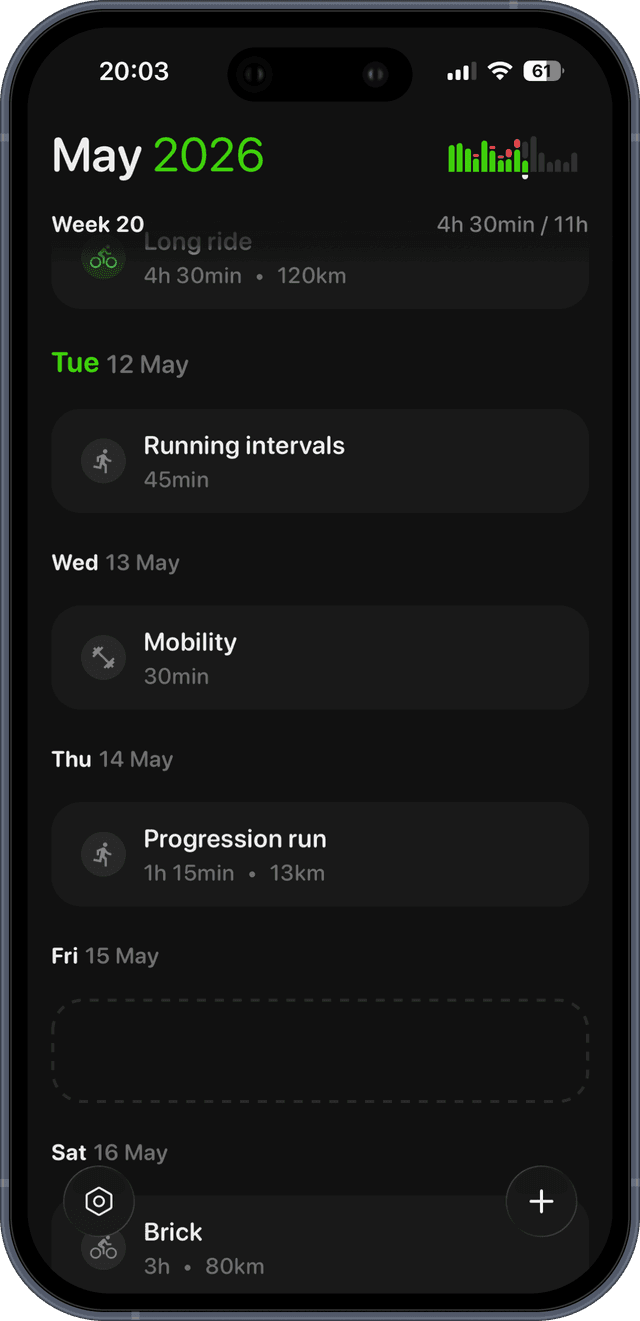
See your own fitness, fatigue and form.
Connect Garmin, Wahoo or Apple Health and Shape draws the chart from your history, then projects it forward from the workouts on your calendar. Free for 14 days.